Concepts and architecture
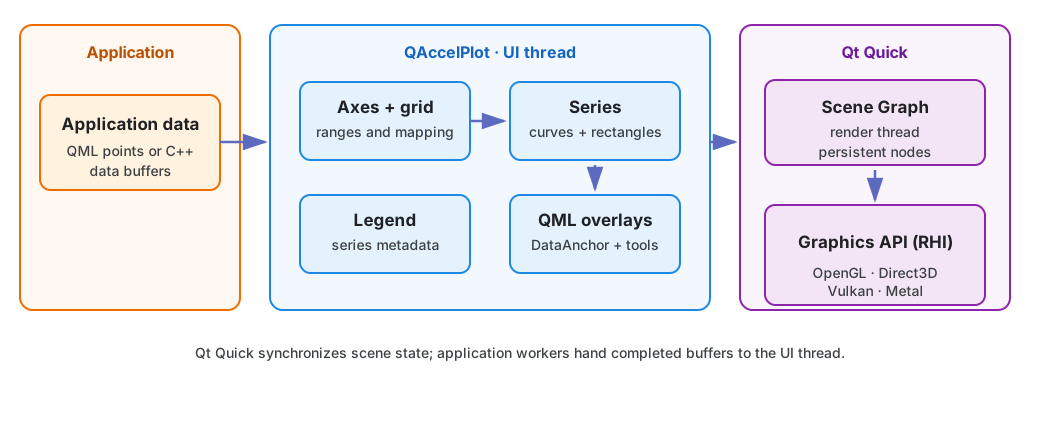
Plot and PlotView
PlotView is the C++ plot item. It lays out axes, converts between data and
pixel coordinates, handles pan and zoom, and collects child series.
Plot is the QML wrapper most applications use. It adds a Legend,
legendModel, and legendVisible to the full PlotView interface.
plotRect is the data area, excluding axes and padding. Use it to
place clipped overlays and custom tools.
Axes and ranges
An Axis has two related ranges:
- The viewport range (
viewportMin,viewportMax) is visible. - The data range (
dataMin,dataMax) is the extent reported by attached series.
Panning and zooming change the viewport. rescaleToData()
sets the viewport to fit the data range, and autoRescale
does so on every data update. A series reports its extent to the
axes set in its xAxis and yAxis properties.
The extent is
computed on demand.
| Plot property | Side |
|---|---|
xAxis |
Bottom |
x2Axis |
Top |
yAxis |
Left |
y2Axis |
Right |
extraAxes |
Set by each axis's side |
Each series selects its own axes.
AxisTicker controls tick count, subticks, lengths, colors, fonts, rotation,
and label formatting. Built-in formatters cover numeric, date/time,
logarithmic, and categorical labels; TickLabelFormatter also accepts a
JavaScript callback.
Series
PlotSeries holds properties shared by all series: name, axes, plot rectangle,
legend symbol, hoverEnabled, hovered, and count, the number of stored records. legendEntry() describes how a legend draws the series;
LegendModel lists the entries of the visible series that have one.
LineCurve renders lines, markers, line styles, gradients, and fills. It
accepts data from QML or C++ buffers, as doubles or as interleaved floats.
PointCloud renders unconnected points as markers, colored uniformly or by a
per-point value through a Colormap.
HeatmapSeries renders a uniform grid of values as cells colored through a
Colormap, placed by the outer edges of the grid. PointCloud and
HeatmapSeries derive from ColormappedSeries, which resolves the value range
that a ColorBar shows.
BandSeries fills the area between a low and a high value at each X, such as
confidence intervals and envelopes. It stores (x, low, high) triples and
can draw lines along both edges.
ErrorBarSeries draws a capped line from a low to a high bound at each data
point, along the Y axis or, with orientation: Qt.Horizontal, the X axis. It
stores (x, y, low, high) quadruples and does not draw the values.
RectangleSeries renders many data-space rectangles in one item, such as event
spans and state timelines. Infinite edges reach the plot edge, and a
per-rectangle category selects the fill color.
BarSeries renders bar charts from (position, value) pairs. barWidth,
barOffset, and baselineValue shape the bars in the shader, and
orientation selects vertical or horizontal bars. Ranged bars carry their
own extent as (from, to, value), e.g. the bins of a histogram.
Hover
Only the topmost series under the mouse pointer is hovered. Every series except
HeatmapSeries reports hovered; hoverEnabled: false leaves hover to the
series beneath. The other hover properties depend on what the series draws:
| Series | Hovered over | hoveredIndex |
hoverRadius |
hoverColor |
|---|---|---|---|---|
LineCurve |
The line within hoverRadius, a marker within its size |
— | 10 | — (drawn lighter) |
PointCloud |
The nearest point within hoverRadius of its center |
Yes | 6 | — |
ErrorBarSeries |
The nearest error bar within hoverRadius |
Yes | 6 | Colors.dark.hover |
BarSeries, RectangleSeries |
A bar or rectangle | Yes | — | No highlight |
BandSeries |
The band or an edge line | — | — | — |
The hoverRadius and hoverColor columns give the defaults. hoverRadius: 0
on a line drawn over another series leaves hover to the series beneath.
Invalid data points and gaps
LineCurve applies one invalid-data-point contract to rendering, gradient fills,
dash patterns, transitions, auto-ranging, and hover hit testing. For the other
series, see bands,
error bars,
point clouds, and
bars.
A data point is invalid when its X or Y coordinate is NaN or ±Inf, or when a
coordinate is zero or negative on a logarithmic axis. Mark missing data by
inserting a data point with a NaN coordinate. JavaScript null and undefined
are not gap markers.
Gap rendering is configured through the curve's gaps grouped
property. gaps.nanMode selects how the line and fill treat invalid data points:
gaps.nanMode |
Behavior |
|---|---|
NanGapMode.Break (default) |
No segment or fill is drawn to or from an invalid data point. Valid neighbors end squarely, and a valid data point isolated between two invalid data points draws no line. With a step mode, a value still holds up to the X of an invalid neighbor when that X is finite. |
NanGapMode.Connect |
Invalid data points are skipped and the line, fill, and hit test join the nearest valid data points. |
Despite its name, nanMode applies to every invalid data point, including ±Inf
and non-positive log-axis values.
In both modes:
- Markers are never drawn for invalid data points.
- Auto-ranging judges each coordinate on its own. A data point with a valid X and an invalid Y still extends the X range, so a dropout keeps its timestamp. If a dimension has no valid coordinate, the series clears that range.
- Dash patterns continue across a gap; the gap contributes no dash length.
MorphTransitionshows a data point that becomes invalid as a gap immediately, and a data point that becomes valid jumps to its target instead of animating fromNaN.- Hover never reports a hit on an invalid data point or across a break.
Composition and overlays
Ordinary QML items can be placed above the grid and series. DataAnchor maps
one or two data coordinates to a QML item's geometry, so labels, event lines,
regions, and drag handles follow the data while panning and zooming.
For custom tools, PlotView provides dataToPixelX(),
dataToPixelY(), pixelToDataX(),
pixelToDataY(), and isInsidePlotArea().
Accepting a plot mouse event suppresses the default pan.
Rendering and threads
QML objects and setters run on the UI thread; Qt synchronizes their state to the Scene Graph render thread. Curve renderers keep persistent Scene Graph nodes and use precompiled shaders for the active graphics API. The software backend cannot run these shaders.
Produce data on a worker thread if needed, but never mutate UI objects from it.
Use LineCurve::postData() or a queued call. See
Background data production.