Example gallery
Every example is a complete application in the
examples/
directory. Build them with -DQACCELPLOT_BUILD_EXAMPLES=ON:
cmake -S . -B build -DCMAKE_BUILD_TYPE=Release -DQACCELPLOT_BUILD_EXAMPLES=ON
cmake --build build --config Release
Each executable is named after its example, for example
QAccelPlotExampleVibrationMonitoring.
Showcases
-
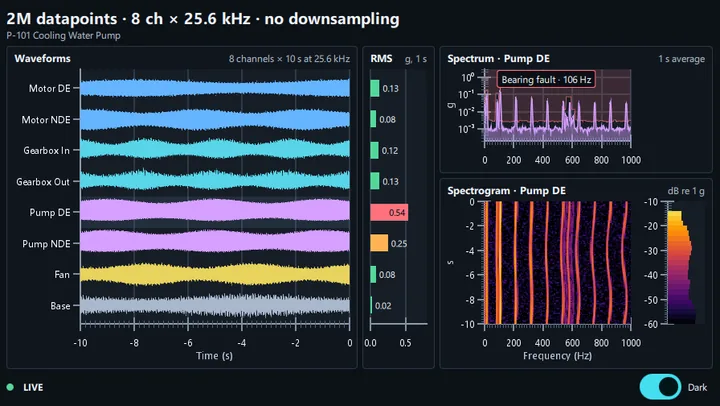
Condition-monitoring dashboard: eight accelerometers streaming 2M samples into scrolling waveforms, RMS bars, a spectrum with a bearing-fault peak, and a spectrogram.
-
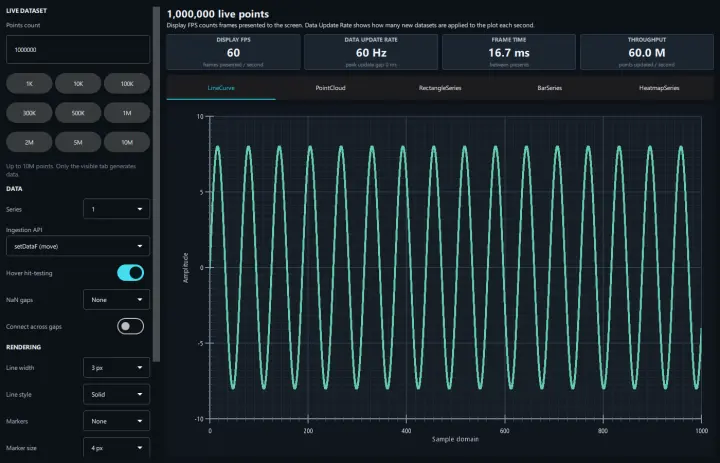
Stream up to 10M points, rectangles, or bars, or 100M heatmap cells, per tab and compare the cost of series count, ingestion API, and rendering options.
-
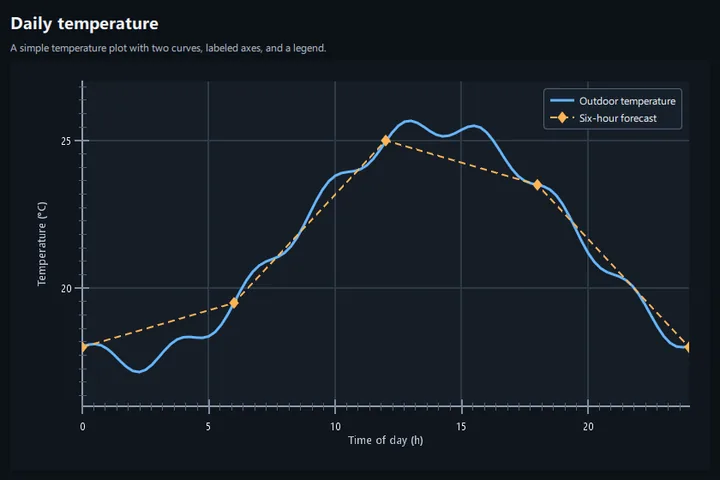
Minimal plot setup. Recipe: Basic static plot.
Plot types
-
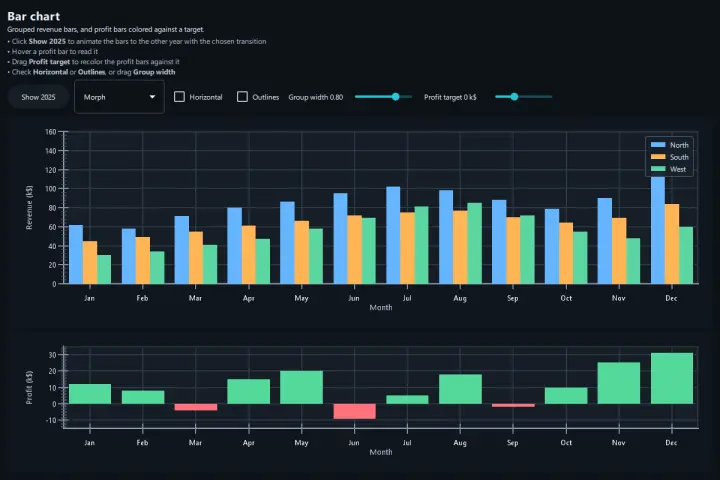
Grouped monthly revenue with a horizontal toggle, profit bars colored against a target baseline, and animated updates. Recipe: Bar charts.
-
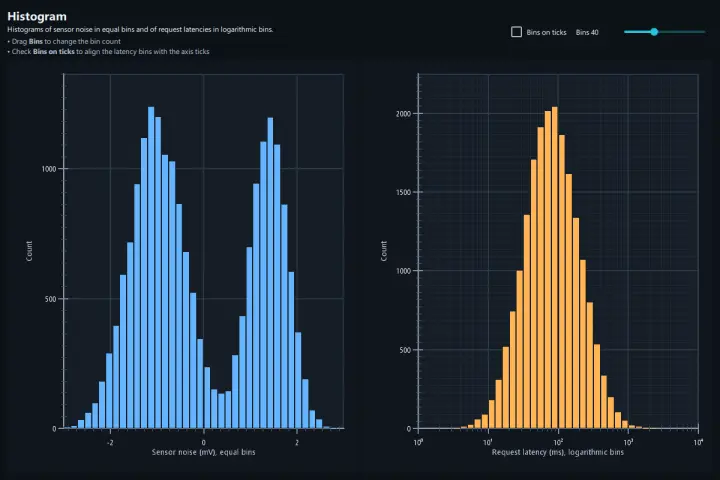
Sensor noise in equal bins, and request latencies in logarithmic bins or as density in one bin per axis tick. Recipe: Histograms.
-
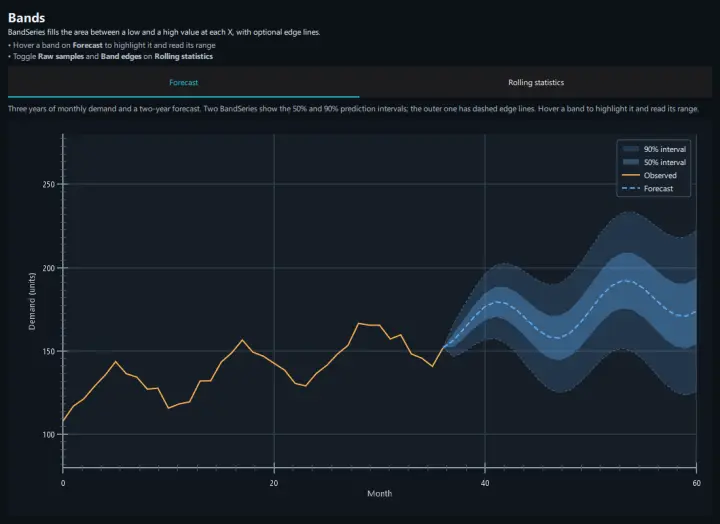
Forecast with nested prediction intervals, and a rolling mean ± 2σ band over a simulated sensor signal. Recipe: Bands.
-
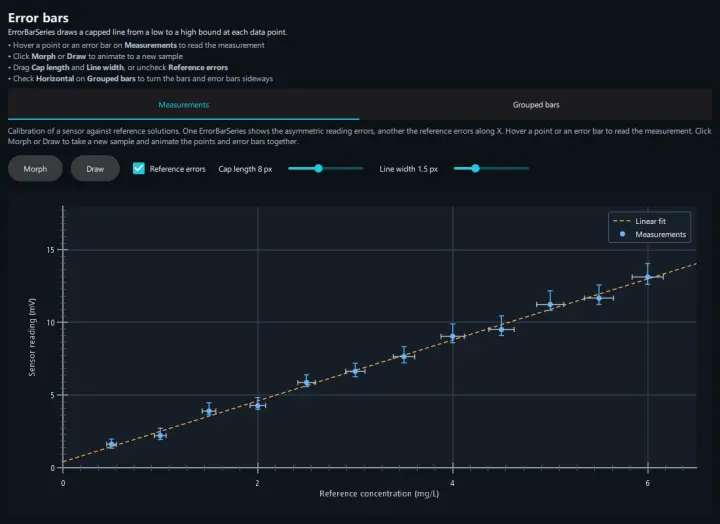
Calibration measurements with asymmetric errors, animated between samples, and error bars on grouped bars. Recipe: Error bars.
-
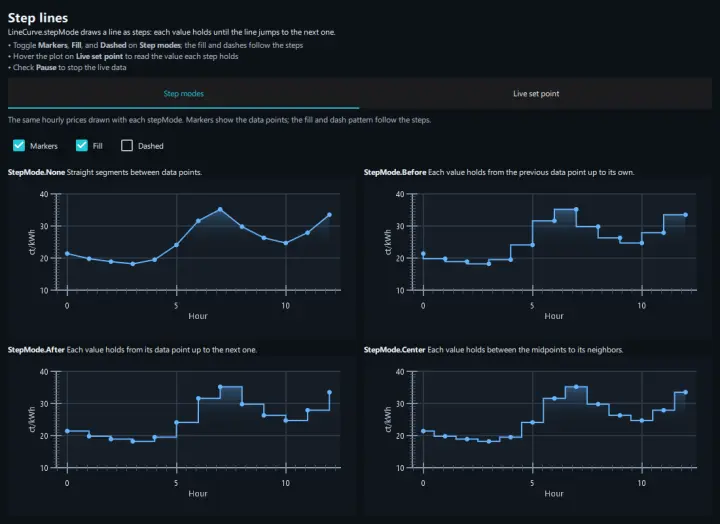
Hourly prices drawn with each step mode, and a live heater set point held as steps over the measured temperature.
-
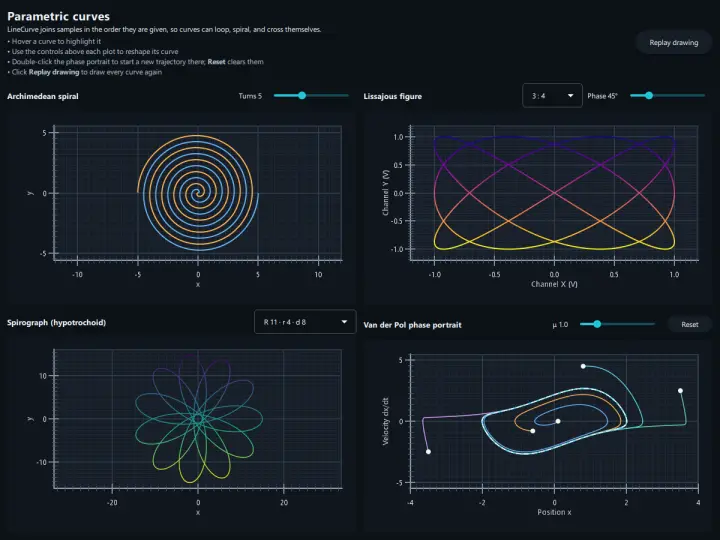
Spiral, Lissajous figure, spirograph, and Van der Pol phase portrait: curves that loop and cross themselves.
-
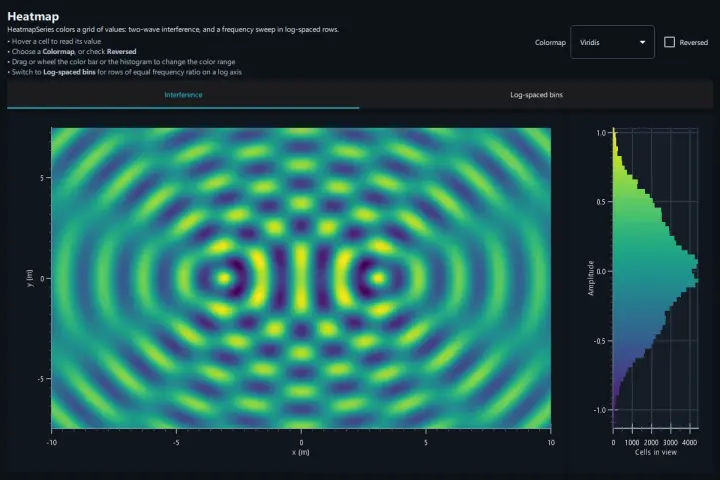
Two-source wave interference on a 400 × 300 grid, keyed by a histogram of the cells in view, with colormap presets and an interactive color bar. Recipe: Heatmaps.
-
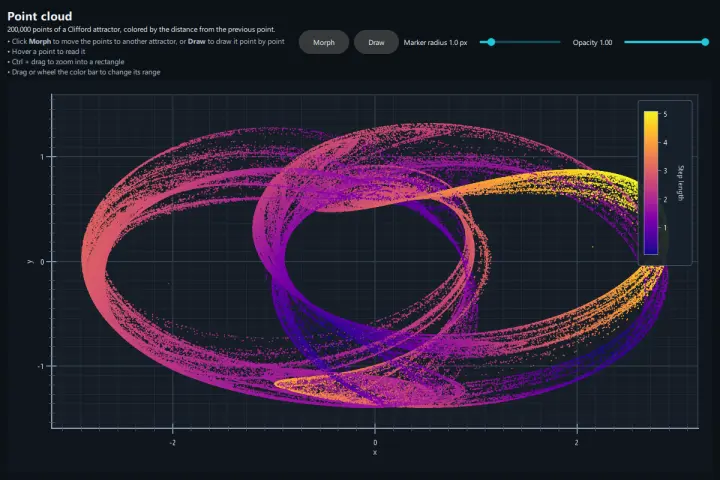
200K-point scatter colored by value, with a hover tooltip, rectangle zoom, and transitions between datasets. Recipe: Point clouds.
-
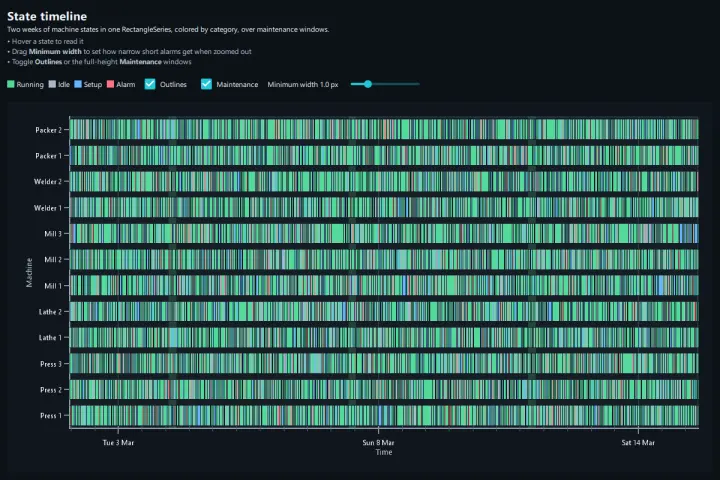
Two weeks of machine states in one
RectangleSeries, colored by category, over full-height maintenance windows.
Styling
-
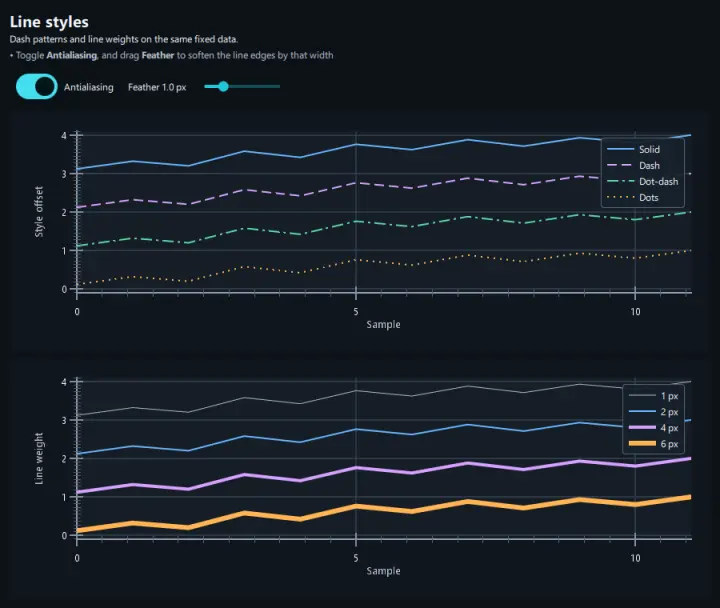
Dash patterns, line weights, and antialiasing. Recipe: Styling.
-
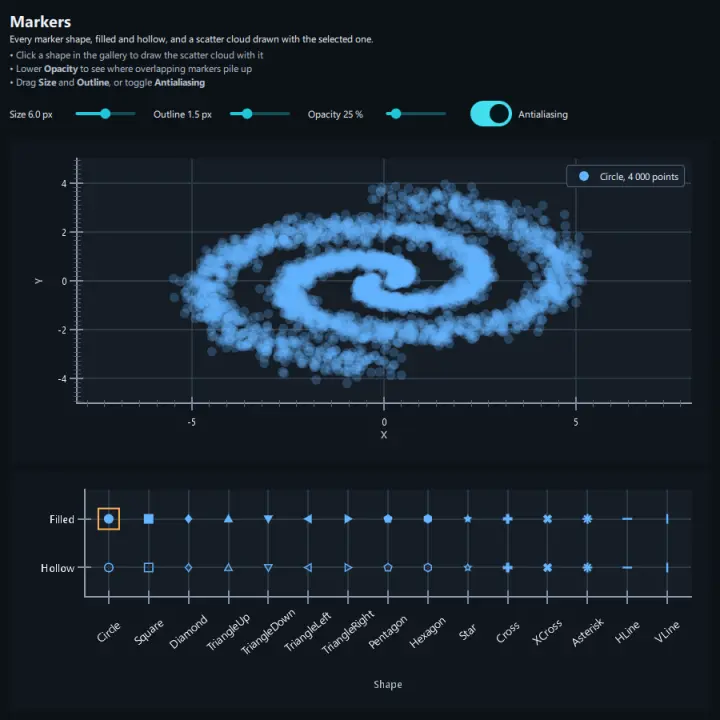
Every marker shape, filled and hollow; click one to draw a scatter plot with it.
-
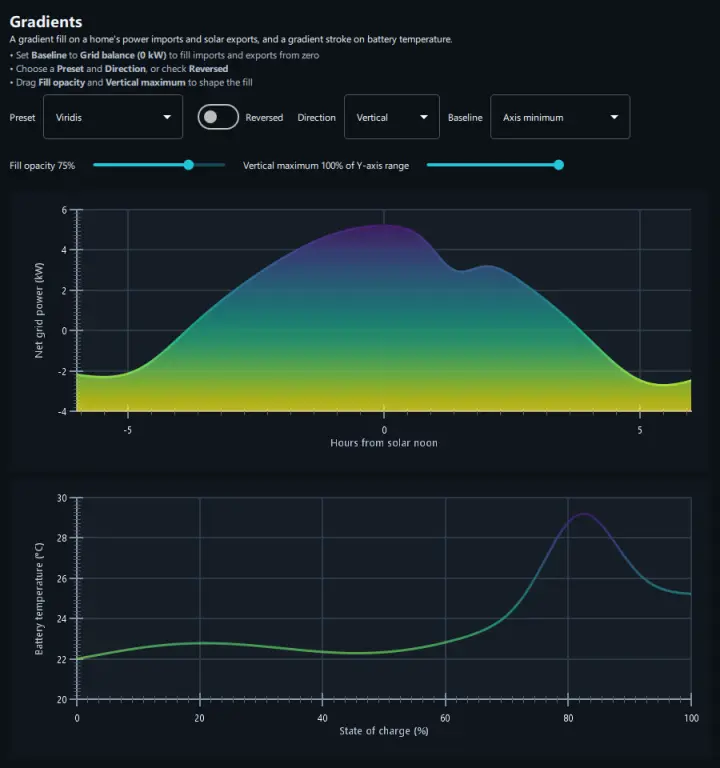
Gradient area fills and strokes with presets, direction, and baseline.
-
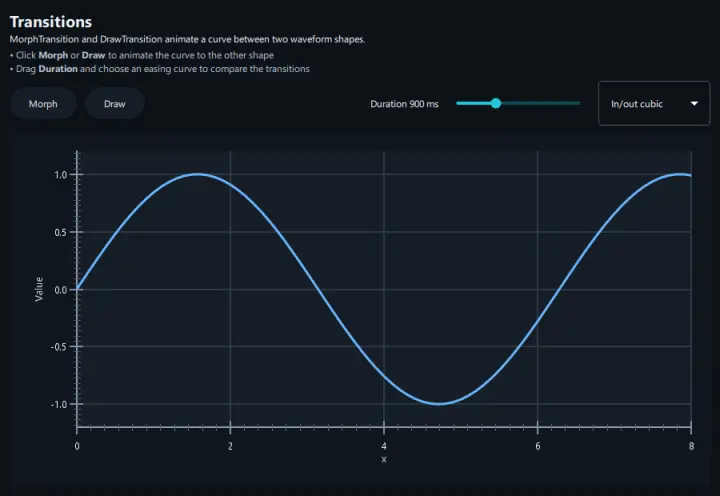
Morph and draw animations between datasets.
-
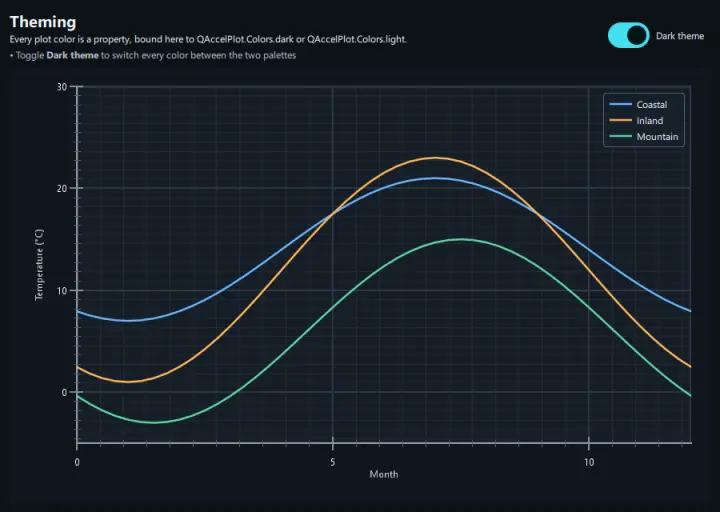
Plot, axis, grid, legend, and series colors bound to the dark or light palette.
Axes
-
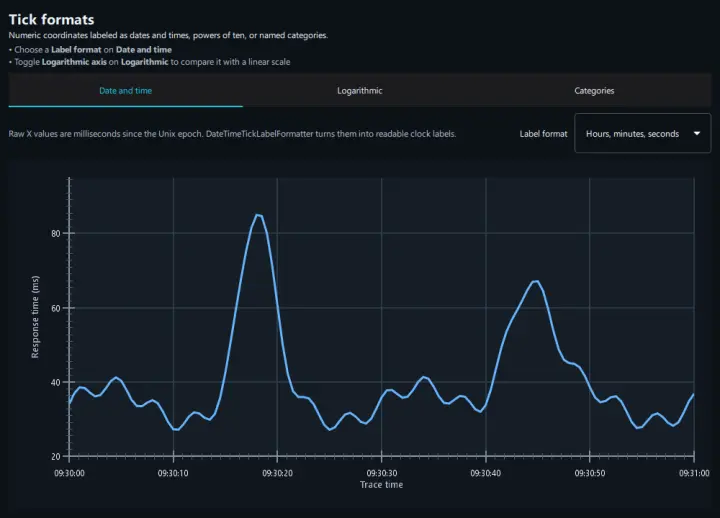
Category, logarithmic, and date/time tick labels. Recipe: Axis formats.
-
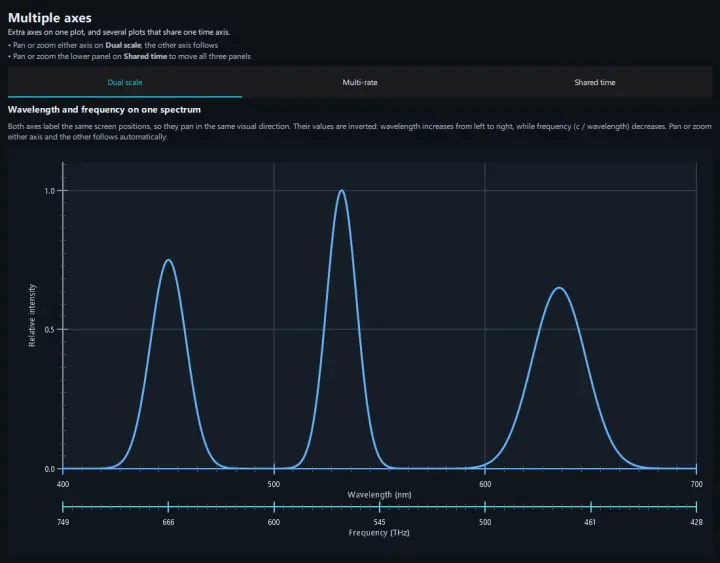
Dual wavelength/frequency scale, multi-rate time axes, and ECG panels sharing one time axis. Recipe: Multiple axes.
Data
-
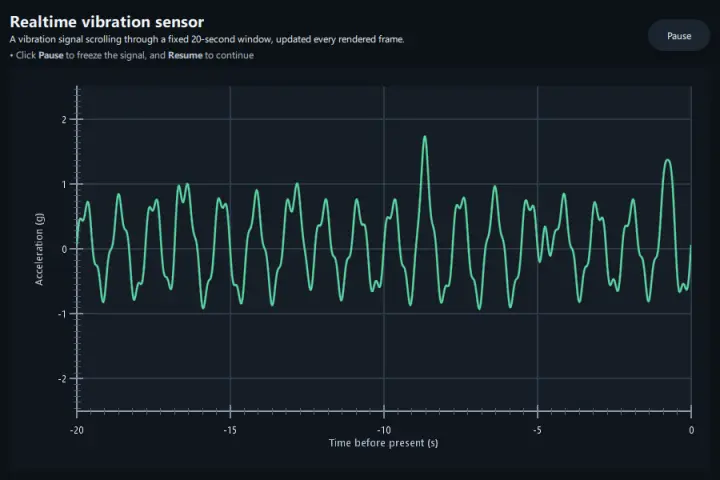
Scrolling vibration signal in a 20-second window, updated every frame. Recipe: Real-time scrolling data.
-
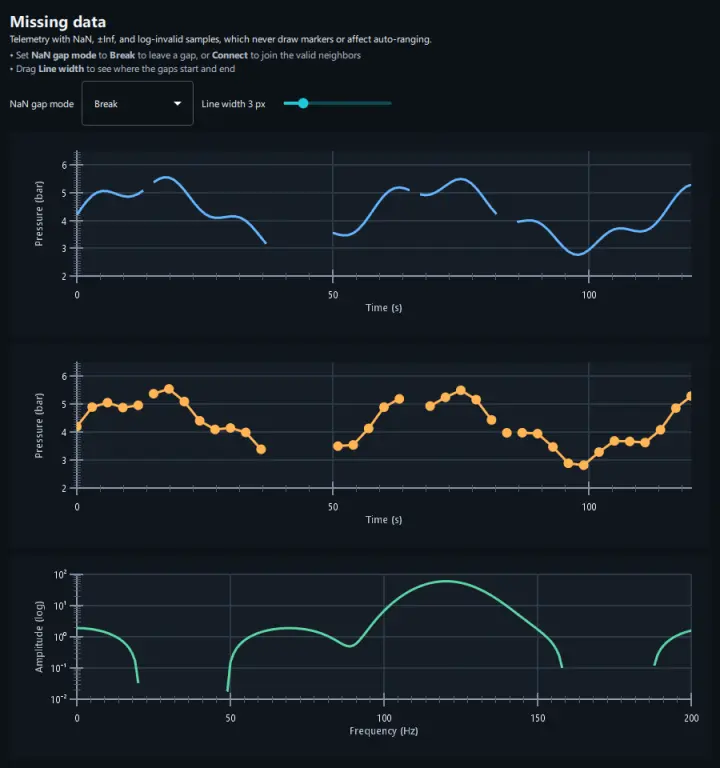
NaN,±Inf, and log-invalid data points drawn as gaps or connected. -
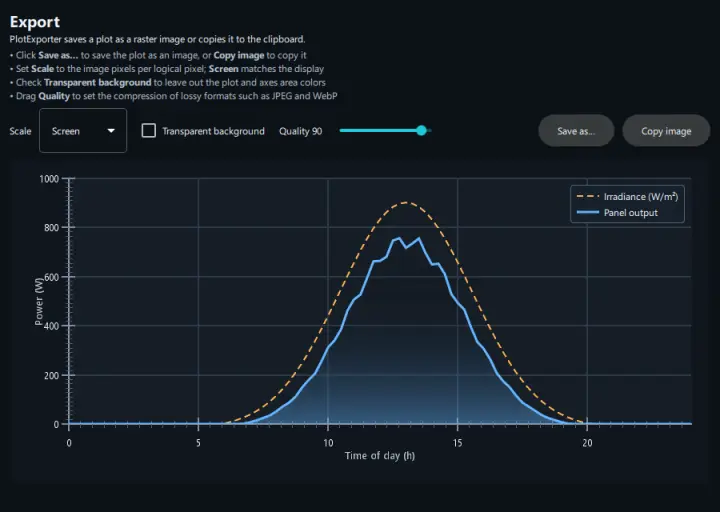
Save a plot as PNG, JPEG, WebP, or TIFF at a chosen scale and background, or copy it to the clipboard. Recipe: Exporting images.
Interaction
-
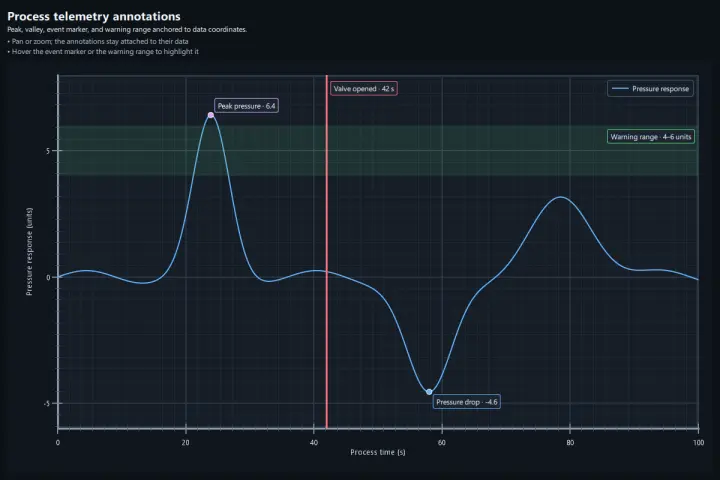
QML overlays anchored to data coordinates. Recipe: Annotations and tools.
-
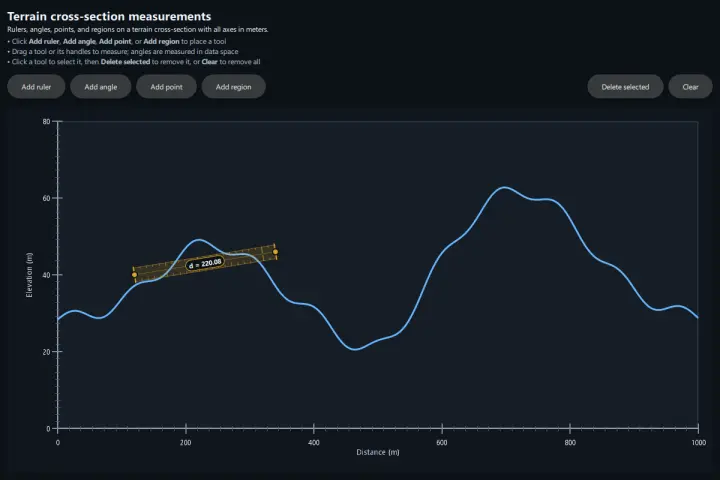
Distance ruler, angle tool, rectangular selection, and point markers.
-
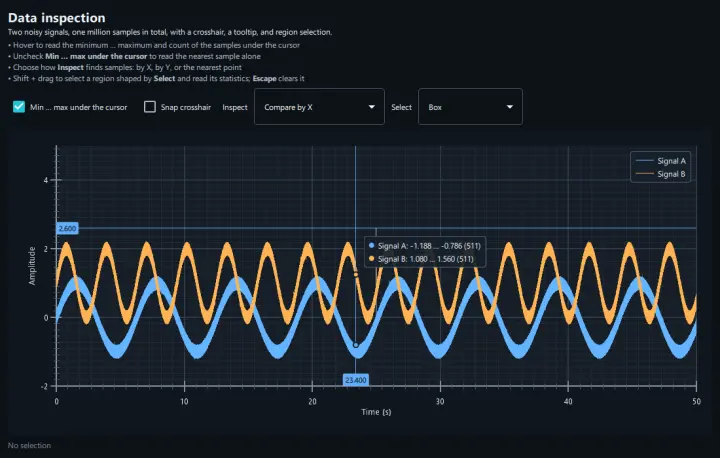
Crosshair, per-series tooltip, and region selection with statistics over one million data points. Recipe: Data inspection.